📈Best Trading Tools
This list encompasses various trading tools designed to enhance the trading experience and improve decision-making. These tools offer features such as market analysis, risk management, and performance tracking, catering to both novice and experienced traders.
- 0
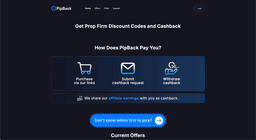
PipBack is a discount and cashback hub built specifically for prop firm traders. Instead of just giving you a coupon code, PipBack shares part of its affiliate revenue back with you as cashback, on top of some of the best discounts publicly available for leading futures and CFD prop firms. Using PipBack is simple: choose your preferred prop firm or trading tool from the offer list, buy your challenge or subscription through the tracked link and discount code, then submit a quick cashback request. Once your request is verified and your cashback balance reaches the minimum threshold, you can withdraw via PayPal or bank transfer.
- 0

See through charts with orderflow. Spot rekt traders with liquidations, track smart money with liquidity heatmaps, detect unusual volume and backtest it. Powered by TradingView. Introducing FlowMap FlowMap is built to be minimal, yet a powerful orderflow tool for TradingView. FlowMap can be used on all markets and timeframes with advanced orderflow features, analytics with historical likelihoods as well as automation with alerts and scans. Features of FlowMap Liquidity Heatmap Find deep liquidity. See where traders are likely setting large buy and sell orders, ready to be swept. Internal Flow See unusual volume with an X-ray view through candles. Detect aggressive high value orders hiding in inside candles. Value Area & POC Follow the flows. See where majority of traders executed their trades and where the pinnacle of interest is located. Liquidations Spot rekt traders with significant stop-loss triggered liquidations and identify when the path of least resistance is turning. Backtesting Validate trade ideas with data. See historical volume and price impact for any single orderflow event or combine multiple ones. Alerts Stop skimming through charts manually. Create a custom alert and get notified when flows are turning. Market Scans Automate finding opportunities. Scan hundreds of charts at once for volume events. How to Use FlowMap Spot trapped traders See when traders are absorbed into limit orders and get trapped. Ride the loss-cover fueled squeeze. Catch trends early Catch smart money initiating trends with conviction using aggressive hidden flows. Ride breakouts Join strong flows moving the markets on liquidity pool breakouts. Find pain trades Counter-trade liquidated traders puking their positions and exhausting price, turning path of least resistance to opposite direction. Identify key levels Predict in advance where price will find resistance using liquidity pools.
- 0

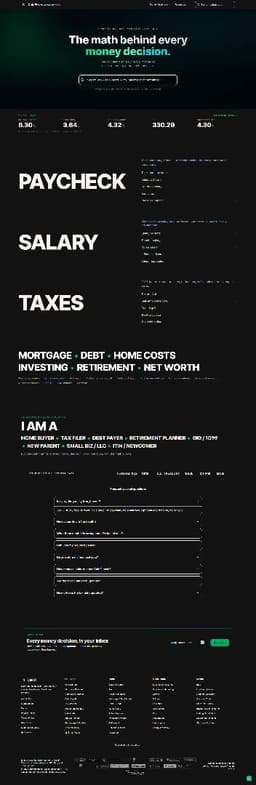
AI market intelligence, real-time execution, clear insights for traders who value focus Meet DealSize.ai Where AI intelligence meets real-market execution. Strategy, product updates, and expert insights for traders who value precision and clarity. A powerful AI platform designed to help you see the markets clearly, access meaningful insights, and act on them instantly. What you get: • Live AI chat for real-time market insight • Interactive widgets that reveal what’s driving the market • Broker integrations for seamless execution • A faster, clearer, more actionable experience 🌍 Powered by AI. Made for Traders
- 0

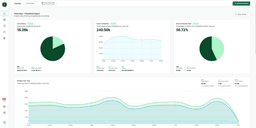
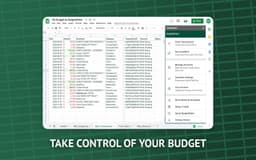
OptionIncome is an option trade tracker and options analytics platform that helps traders automatically track option trades, analyze performance, and understand their real trading results. Active option traders often manage many positions across different symbols, strategies, and expiration cycles. OptionIncome acts as an automated option trading journal and options portfolio tracker, organizing your entire trading activity into a single analytics dashboard. Users can connect brokerage accounts to automatically import option trades, equity positions, and historical transactions. The platform then structures this data into clear analytics that help traders track performance across symbols, strategies, and time periods. OptionIncome helps traders analyze real trading performance by consolidating trade history, tracking rolling positions, and organizing complex option activity that is difficult to manage with spreadsheets. Key capabilities include: 1.Automatic option trade tracking across brokerage accounts 2.Option trading journal that records historical trades and performance 3.Options portfolio analytics to evaluate profit and loss over time 4.Symbol-level trade history to analyze performance on specific stocks 5.Strategy insights to understand how different option strategies perform 6.Unified dashboard to monitor positions and portfolio activity in one place Instead of maintaining spreadsheets or manual journals, OptionIncome provides a dedicated platform to track option trades, analyze trading performance, and gain deeper insights into your options portfolio.
- 0
SignalBoss helps traders verify Telegram trading signals before risking real money. The trading world is flooded with signal providers promising massive returns, but many inflate results and hide losses. SignalBoss cuts through the noise with instant, AI-powered backtesting. The workflow is simple: forward any trading signal from a Telegram channel to the SignalBoss bot. The AI parses the signal, identifies entry price, stop loss, and take profit levels, then runs a backtest against real 1-minute candle data from professional market data providers. Within 30 seconds, users receive a detailed report with an interactive chart, profit/loss breakdown, and a built-in profit calculator. SignalBoss supports a wide range of instruments including 20+ forex pairs, thousands of cryptocurrencies via Binance and DEX aggregators, commodities like gold, silver, and crude oil, and major indices such as the S&P 500 and NASDAQ 100. Both text-based and image-based signals are supported, and the engine handles market orders as well as limit orders. The backtesting engine is deliberately conservative. When both take profit and stop loss are hit within the same 1-minute candle, it assumes the worst case scenario, ensuring results are realistic rather than artificially inflated. New users get 10 free credits with no payment required. Credit packs start at EUR 2.49 for 10 analyses, scaling up to EUR 24.99 for 200. For heavy users, a monthly subscription at EUR 19.99 offers up to 2,000 analyses per month. Credits never expire. SignalBoss is built for traders who want data-driven decisions, not hype. Verify any signal provider with real market data before you invest.
- 0
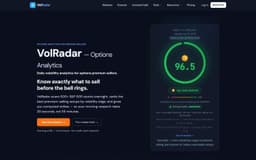
VolRadar is a specialized options analytics platform built for traders who focus on selling premium strategies, offering a faster, more structured way to approach daily market decisions. Instead of spending hours analyzing charts, volatility metrics, and earnings calendars across multiple platforms, VolRadar consolidates everything into a single, streamlined experience. Its primary goal is to help users quickly determine whether market conditions are favorable for premium selling and identify the best opportunities with minimal effort. At the center of the platform is the concept of the “Weather Score,” a simple but powerful indicator that summarizes overall market conditions into a single number between 0 and 100. This score acts like a forecast for options traders, signaling whether the current environment favors selling premium or whether it’s better to stay cautious. By translating complex data into a clear, actionable metric, VolRadar removes much of the uncertainty and guesswork that traders typically face. Instead of interpreting multiple indicators separately, users can rely on one unified signal to guide their decisions. VolRadar scans more than 500 stocks from the S&P 500 universe every day, analyzing volatility patterns and identifying setups with the highest potential edge. These opportunities are ranked and presented in a way that allows traders to quickly select a ticker and move forward with confidence. The platform highlights key metrics such as implied volatility rank, volatility risk premium, and signal strength, all in one place. This structured approach helps users focus on high-probability setups rather than getting overwhelmed by too many choices. Another defining feature of VolRadar is its ability to reduce research time dramatically. Traditional workflows often require checking multiple sources like charting platforms, volatility data providers, and earnings calendars, which can take close to an hour each day. VolRadar replaces this fragmented process with a simple four-step routine that can be completed in about 30 seconds. Users check the market conditions, choose a ticker from the ranked list, review the analysis, and build their trade using pre-computed strategies. This efficiency makes it especially valuable for busy professionals who want to trade consistently without dedicating large amounts of time to research. The platform also includes a built-in strategy builder that simplifies trade execution. Instead of manually calculating strikes, risk levels, and profit potential, users are provided with pre-filled strategies such as short puts, credit spreads, and iron condors. Each strategy comes with clear details, including break-even points, maximum loss, and expected returns. This not only speeds up the decision-making process but also helps traders better understand the structure and risk of their positions. VolRadar is designed to support a variety of trading styles within the premium-selling space. Whether someone focuses on wheel strategies, spreads, or multi-leg options like strangles and iron condors, the platform adapts to those needs by ranking strategies based on current market conditions. It is particularly aligned with traders who follow time-based approaches, such as entering positions around 30 to 45 days to expiration and managing them over time. Another important aspect of the platform is its educational value. Rather than simply presenting numbers, VolRadar provides context and explanations that help users understand what each metric means and how it influences trading decisions. This makes it a useful tool not only for experienced traders but also for those who are still learning and want to build a deeper understanding of volatility and options strategies through practical application. In addition to its analytical capabilities, VolRadar emphasizes accessibility and simplicity. Users can start with a free tier that provides essential insights like the daily Weather Score and a limited set of top-ranked opportunities. For those who want a more comprehensive experience, the platform offers expanded access to the full scanner, multiple strategy recommendations, and additional tools. This flexible structure allows traders to choose the level of functionality that fits their needs without unnecessary barriers. Ultimately, VolRadar transforms the way options traders approach their daily routine. By combining institutional-grade data with a clean, intuitive interface, it replaces time-consuming analysis with fast, actionable insights. It enables traders to move from uncertainty to execution in seconds, making the process of identifying and acting on premium-selling opportunities more efficient, consistent, and accessible.
- 0

MadeOnSol is a comprehensive platform built around the rapidly growing Solana ecosystem, designed to help traders, developers, investors, and blockchain enthusiasts discover powerful tools, monitor smart money activity, and access real-time Solana market intelligence from a single centralized destination. The platform combines analytics, wallet tracking, deployer intelligence, trading data, API services, and educational content into one ecosystem, making it an advanced resource for anyone actively involved in the Solana blockchain space. One of the core strengths of MadeOnSol is its massive database of Solana-related tools and applications. The platform tracks more than 1,030 tools across over 30 different categories, including DeFi, analytics, developer tools, security, gaming, wallets, payment solutions, and data indexing platforms. This organized structure allows users to easily browse, compare, and discover the best products within the Solana ecosystem. Whether someone is searching for a trading terminal, portfolio tracker, staking solution, RPC provider, or blockchain analytics platform, MadeOnSol provides a streamlined way to explore the most useful services available on Solana. MadeOnSol is especially known for its advanced blockchain intelligence systems. The platform tracks over 1,000 KOL wallets in real time, allowing users to monitor the behavior of influential traders and profitable wallets across the Solana network. Through detailed profit-and-loss leaderboards, token activity breakdowns, and coordination detection systems, traders can identify patterns, discover trending tokens, and analyze how experienced market participants operate. This gives users valuable insight into smart money movements before trends become widely recognized by the public. Another major feature of MadeOnSol is the Deployer Hunter system, which profiles thousands of token deployers and evaluates their historical performance. Users can instantly check whether a deployer has a strong success rate or a risky background, helping them make more informed decisions when exploring newly launched memecoins or experimental Solana projects. The platform also includes an Alpha Wallets system that scores more than 47,000 early buyers, helping traders identify wallets with strong win rates and profitable trading histories. For developers and advanced users, MadeOnSol offers a powerful Solana API that includes REST endpoints, WebSocket streaming, and all-DEX firehose data. This infrastructure allows builders to integrate real-time Solana trading information, wallet activity, deployer analytics, and token data into custom dashboards, bots, analytics platforms, or blockchain applications. The API is designed to support high-speed access to live blockchain information, making it useful for projects that depend on accurate and immediate market data. One of the platform’s most valuable tools is its real-time Telegram alert system. Users can receive instant notifications about KOL trades, Pump.fun deployer launches, coordination clusters, and copy-trade signals directly through Telegram. These alerts arrive within seconds and include important metrics such as win rate, historical performance, and bond rate, helping users quickly evaluate the quality of each signal without wasting time manually researching blockchain activity. In addition to analytics and trading intelligence, MadeOnSol also focuses on education and community participation. The platform publishes guides, API tutorials, memecoin research articles, and technical resources that help users better understand the Solana ecosystem. Community members can contribute reviews, submit tools, create content, and participate in leaderboards to earn rewards and recognition within the platform. Overall, MadeOnSol is far more than a simple Solana directory. It is a complete blockchain intelligence and developer ecosystem that combines discovery, analytics, real-time alerts, trading insights, and professional-grade API infrastructure into one platform. By centralizing essential Solana data and tools, MadeOnSol helps traders, developers, and crypto enthusiasts navigate the fast-moving Solana ecosystem more efficiently and make smarter decisions in real time.
- 0
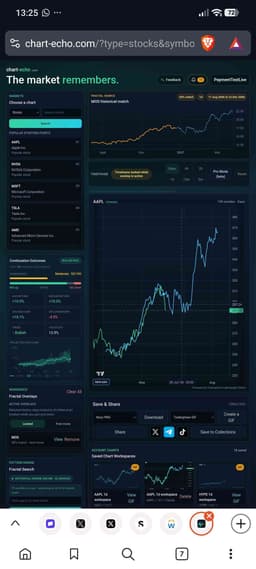
Chart Echo is an AI-powered market research platform designed to help traders and investors make more informed decisions by analyzing historical market behavior. Instead of relying solely on indicators, opinions, or predictions, the platform searches through years of market data to find historical chart patterns that closely resemble the current setup of a stock or cryptocurrency. By showing what happened after similar patterns appeared in the past, Chart Echo gives users valuable context and probabilistic insights before entering a trade or investment. The core idea behind Chart Echo is simple yet powerful: financial markets often produce recurring patterns, and historical price action can provide clues about potential future outcomes. Users can enter the ticker symbol of a stock or cryptocurrency they are monitoring, such as Nvidia, Apple, Tesla, or Bitcoin, and the platform automatically scans millions of historical chart formations to identify the closest matches. Once those matches are found, Chart Echo analyzes what happened next and presents the results in an easy-to-understand format. One of the platform’s key strengths is its ability to display continuation outcomes based on historical similarities. Rather than making direct predictions, Chart Echo provides statistical probabilities showing how comparable setups performed in the past. Users can see the percentage of instances that resulted in upward, downward, or sideways movement. This approach allows traders to evaluate opportunities through data-driven probabilities rather than emotion or speculation. To help users assess risk and reward, the platform presents several performance metrics derived from historical matches. These include average returns, median returns, average maximum gains, average drawdowns, trend direction, confidence scores, and volatility measurements. By reviewing these statistics, traders can gain a clearer understanding of the potential upside and downside associated with a specific market setup. This information can be especially useful when evaluating trade entries, position sizing, and risk management strategies. Chart Echo supports multiple timeframes, allowing users to analyze market behavior across different trading styles. Premium users gain access to intraday timeframes such as 4-hour, 2-hour, 1-hour, 15-minute, and 5-minute charts, while daily pattern searches are available to all users. This flexibility makes the platform useful for both long-term investors and short-term traders who require more detailed market analysis. Another notable feature is the platform’s projected path visualization, which helps users understand how historical matches evolved over time. By examining the collective behavior of similar patterns, traders can visualize possible future price paths and better prepare for different market scenarios. While the platform does not provide financial advice, it offers valuable research tools that help users make decisions based on historical evidence rather than guesswork. Premium subscribers gain access to additional capabilities designed for more advanced market analysis. These include live pattern alerts, saved setup reminders, unlimited chart workspaces, advanced precision controls through Pro Mode, multiple fractal visualization styles, and watermark-free exports. These features make the platform particularly attractive for active traders who regularly monitor multiple assets and require a more comprehensive workflow. One of the most appealing aspects of Chart Echo is its accessibility. Users can try the platform immediately without creating an account, allowing them to test pattern searches and explore historical market similarities with real data before committing to a subscription. This lowers the barrier to entry and enables traders to quickly evaluate the value of the platform for their specific trading approach. The platform positions itself as a research and decision-support tool, emphasizing that markets involve risk and that historical patterns do not guarantee future results. Instead of promising predictions, Chart Echo focuses on providing historical context and statistical evidence that traders can incorporate into their own analysis. This approach encourages more disciplined and data-informed decision-making. Overall, Chart Echo is a unique market intelligence platform that leverages pattern recognition and historical market data to help traders and investors better understand current market conditions. By finding similar chart setups from the past and revealing how they performed afterward, the platform transforms historical price action into actionable insights. Whether used for stocks or cryptocurrencies, Chart Echo offers a powerful way to explore market behavior, evaluate probabilities, and make more confident trading decisions based on the market’s own memory.
Frequently Asked Questions
PipBack is a discount and cashback hub specifically designed for prop firm traders. It allows users to receive a portion of affiliate revenue back as cashback, in addition to offering some of the best discounts available for leading futures and CFD prop firms. The process is straightforward: traders select a prop firm or trading tool from the offer list, purchase their challenge or subscription through a tracked link and discount code, and then submit a cashback request. Once verified, users can withdraw their cashback via PayPal or bank transfer.
For new traders, PipBack provides an easy way to save money while starting their trading journey. By using PipBack, they can access discounts on prop firm challenges and subscriptions, which can help reduce initial costs. Additionally, the cashback feature allows them to earn back a portion of their spending, making it a cost-effective option for those looking to enter the trading market.
PipBack offers a variety of trading tools, primarily focusing on prop firm challenges and subscriptions. Users can find discounts and cashback offers for leading futures and CFD prop firms, which are essential for traders looking to enhance their trading experience and improve their decision-making.
Yes, there is a minimum threshold that users must reach before they can withdraw their cashback from PipBack. Once your cashback balance meets this threshold and your request is verified, you can withdraw your funds via PayPal or bank transfer.