💹Best Financial Analysis Tools
This list encompasses various financial analysis tools designed to assist users in evaluating investment opportunities and managing financial data. These tools provide essential features for analyzing market trends, assessing risks, and making informed financial decisions.
- 0

SecurePutCalls is a comprehensive financial analysis tool for options traders, focusing on optimizing strategies like cash-secured puts and covered calls. We identify high ROI opportunities using advanced filtering, proprietary risk scoring, and real-time data visualization for the US market. Advanced options analytics for cash-secured puts and covered calls with real-time data, strategy insights, ROI filters & portfolio tracking for Wheel Strategy traders.
- 0

Advanced options analytics for cash-secured puts and covered calls with real-time data, strategy insights, ROI filters & portfolio tracking for Wheel Strategy traders. SecurePutCalls is a comprehensive financial analysis tool for options traders, focusing on optimizing strategies like cash-secured puts and covered calls. We identify high ROI opportunities using advanced filtering, proprietary risk scoring, and real-time data visualization for the US market.
- 0

The World Now tracks conflicts, disasters, and geopolitical risks on a live 3D globe, and predicts how they move markets. Catalyst, our AI market prediction engine, forecasts event impact on 28 assets including Bitcoin, gold, oil, and major indices with severity ratings, directional predictions, and a published track record. Key features: - Live 3D globe tracking wars, earthquakes, volcanoes, and crises every 5 minutes - Catalyst AI connecting geopolitical events to asset price movements - AI-generated breaking news within minutes of detection - Country danger and safety rankings from live data - 30+ tracker pages: current wars, earthquakes, Doomsday Clock, and more - Global Risk Index combining conflict, disaster, and economic stress Built for investors, analysts, and journalists who need to understand what's happening and how it affects markets, before traditional media catches up.
- 0
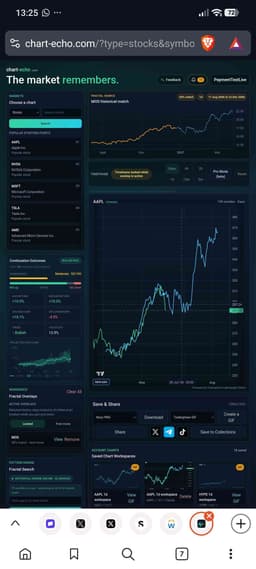
Chart Echo is an AI-powered market research platform designed to help traders and investors make more informed decisions by analyzing historical market behavior. Instead of relying solely on indicators, opinions, or predictions, the platform searches through years of market data to find historical chart patterns that closely resemble the current setup of a stock or cryptocurrency. By showing what happened after similar patterns appeared in the past, Chart Echo gives users valuable context and probabilistic insights before entering a trade or investment. The core idea behind Chart Echo is simple yet powerful: financial markets often produce recurring patterns, and historical price action can provide clues about potential future outcomes. Users can enter the ticker symbol of a stock or cryptocurrency they are monitoring, such as Nvidia, Apple, Tesla, or Bitcoin, and the platform automatically scans millions of historical chart formations to identify the closest matches. Once those matches are found, Chart Echo analyzes what happened next and presents the results in an easy-to-understand format. One of the platform’s key strengths is its ability to display continuation outcomes based on historical similarities. Rather than making direct predictions, Chart Echo provides statistical probabilities showing how comparable setups performed in the past. Users can see the percentage of instances that resulted in upward, downward, or sideways movement. This approach allows traders to evaluate opportunities through data-driven probabilities rather than emotion or speculation. To help users assess risk and reward, the platform presents several performance metrics derived from historical matches. These include average returns, median returns, average maximum gains, average drawdowns, trend direction, confidence scores, and volatility measurements. By reviewing these statistics, traders can gain a clearer understanding of the potential upside and downside associated with a specific market setup. This information can be especially useful when evaluating trade entries, position sizing, and risk management strategies. Chart Echo supports multiple timeframes, allowing users to analyze market behavior across different trading styles. Premium users gain access to intraday timeframes such as 4-hour, 2-hour, 1-hour, 15-minute, and 5-minute charts, while daily pattern searches are available to all users. This flexibility makes the platform useful for both long-term investors and short-term traders who require more detailed market analysis. Another notable feature is the platform’s projected path visualization, which helps users understand how historical matches evolved over time. By examining the collective behavior of similar patterns, traders can visualize possible future price paths and better prepare for different market scenarios. While the platform does not provide financial advice, it offers valuable research tools that help users make decisions based on historical evidence rather than guesswork. Premium subscribers gain access to additional capabilities designed for more advanced market analysis. These include live pattern alerts, saved setup reminders, unlimited chart workspaces, advanced precision controls through Pro Mode, multiple fractal visualization styles, and watermark-free exports. These features make the platform particularly attractive for active traders who regularly monitor multiple assets and require a more comprehensive workflow. One of the most appealing aspects of Chart Echo is its accessibility. Users can try the platform immediately without creating an account, allowing them to test pattern searches and explore historical market similarities with real data before committing to a subscription. This lowers the barrier to entry and enables traders to quickly evaluate the value of the platform for their specific trading approach. The platform positions itself as a research and decision-support tool, emphasizing that markets involve risk and that historical patterns do not guarantee future results. Instead of promising predictions, Chart Echo focuses on providing historical context and statistical evidence that traders can incorporate into their own analysis. This approach encourages more disciplined and data-informed decision-making. Overall, Chart Echo is a unique market intelligence platform that leverages pattern recognition and historical market data to help traders and investors better understand current market conditions. By finding similar chart setups from the past and revealing how they performed afterward, the platform transforms historical price action into actionable insights. Whether used for stocks or cryptocurrencies, Chart Echo offers a powerful way to explore market behavior, evaluate probabilities, and make more confident trading decisions based on the market’s own memory.
Frequently Asked Questions
One of the top financial analysis tools is SecurePutCalls, which is specifically designed for options traders. It focuses on optimizing strategies like cash-secured puts and covered calls. This tool provides advanced options analytics, real-time data, and insights into ROI opportunities, making it easier for traders to make informed decisions.
SecurePutCalls assists users by offering advanced filtering, proprietary risk scoring, and real-time data visualization tailored for the US market. It helps traders identify high ROI opportunities and track their portfolios effectively, particularly for those employing the Wheel Strategy.
When selecting a financial analysis tool, look for features such as real-time data analytics, advanced filtering options, risk assessment capabilities, and portfolio tracking. Tools like SecurePutCalls provide these features, making them valuable for traders looking to optimize their investment strategies.
SecurePutCalls offers several advantages, including the ability to optimize trading strategies for cash-secured puts and covered calls, access to real-time data, and insights into potential ROI. This tool is particularly beneficial for traders who want to streamline their analysis and decision-making processes.